
Performance wise it can be very interesting to use query objects as a data-source in a report (or any other object).
Imagine you want to create a report that shows the top X records from a table, let’s say for example Customers, then creating a report dataset with a top-x filtering can be very cumbersome.
An example is available in report 111 Customer – Top 10 List. Here you see that in order to calculate the top 10 customers, you first need to loop over all customers, then store the top 10 records in a temp table and then loop over the temp table to add its records to the dataset. Imho that seems sub-optimal regarding performance…
There’s a much better way to do this: use a query object.
So let’s create a query for the top X customers:
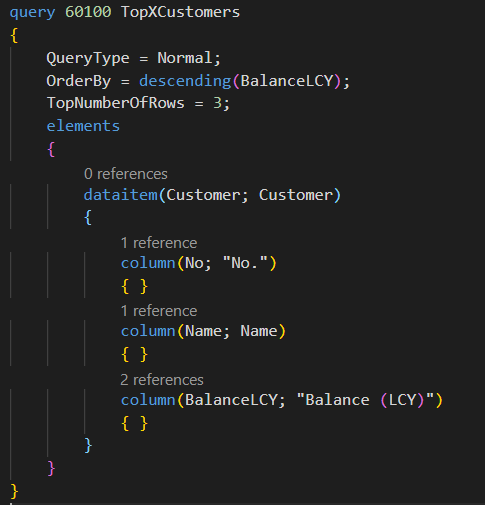
In the screenshot above you see that I’m fetching the No, Name and Balance from the Customer tables, ordered by Balance, descending and only the top 3 records. Ok, let’s now use this query in a report.
(You can use the treport snippet to create a new report.)
Then I will define the following variables:
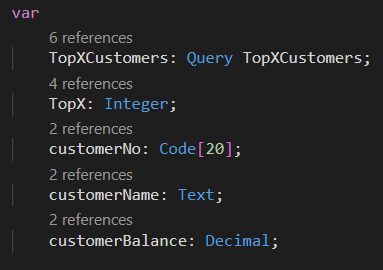
I need a variable for my query and a variable for each field from my query and I will use these in the data item of the report. To dynamically filter my query I will use the TopX integer.
Next I will add a request page to the report that allows the user to filter my query, using the TopX:
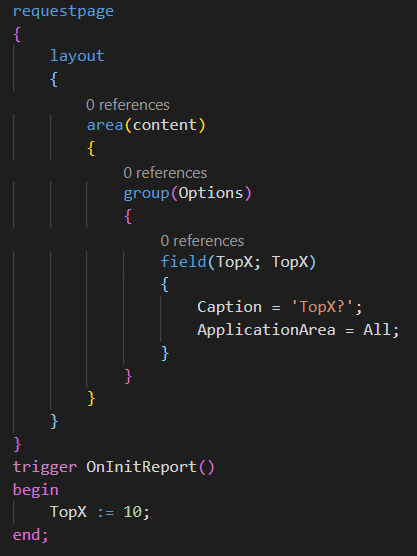
Notice that I initialize TopX as 10, just in case the user ‘forgets’.
Now we need a dataset for the report. You do this by defining one (or more) data item(s). But this gives us a problem, because a data item can only link to a table, and not to a query. We want to use or query as a data item, so we are stuck. Well, you solve this by using a dummy data item, which will serve as a placeholder for our query. In many cases the integer data item is used for such purposes.
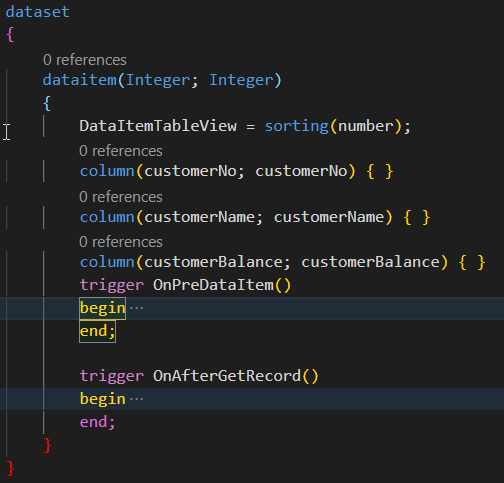
Notice in the above screenshot that I use the integer data item, but I use my variables as columns.
Now we need to figure out a way to get data into the variables, and we need to filter the integer data item. Because there are many integers, we don’t want a dataset containing a row for every integer in the inteer table.
Don’t worry, you will only forget to filter the integer table once in your career as an AL developer 😉
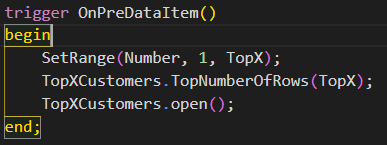
So, we are filtering the integer table starting from 1 to TopX, because that’s exactly how many rows the query needs to return.
Using the TopNumerOfRows() function you filter the query to only return the top X records. Remember that this only works well if you have an Order By in your query… Then the Open() function runs the query.
Now we will use the OnAfterGetRecord() trigger of the integer data item to add the rows from the result set of the query to the report:
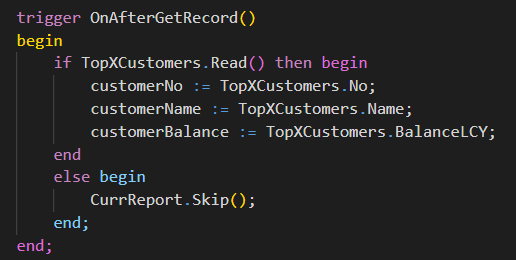
The Read() function retrieves 1 row from the result set of the query. In case there are less records in the result set of the query then you have specified in the TopX variable, we skip the records if there are no more rows.
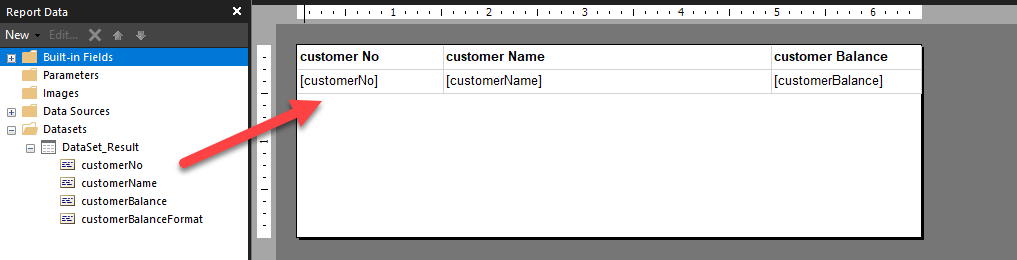
And voila, that’s it. Now we need to create a simple layout:
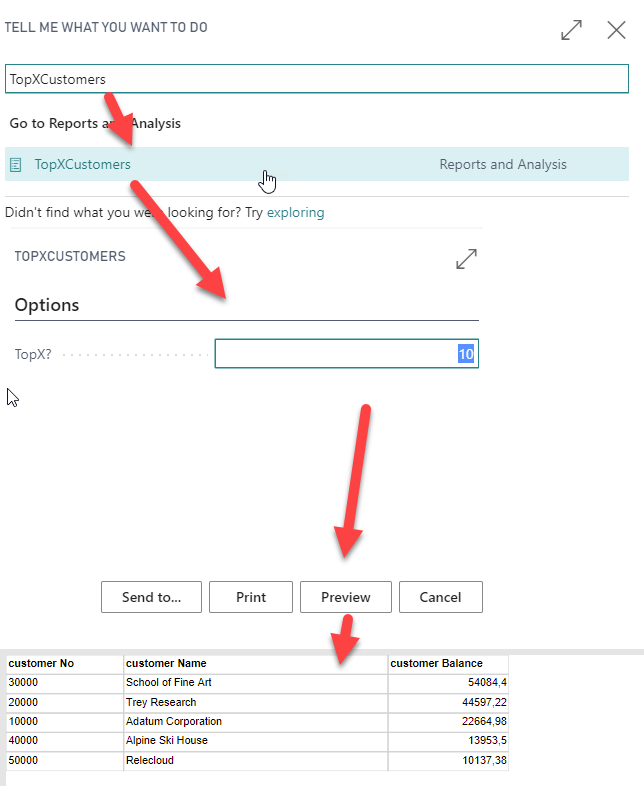
And then deploy and run the report:
You can download an example here:
Nice tutorial. I looked into this one, very informative. By the way, i wanted to sum all the balance of all customer, how do i achieved that in Al code? thanks.